Availability heat-map for 24h, 30d, 1y
API v1.24.0 Admin 0.27.0

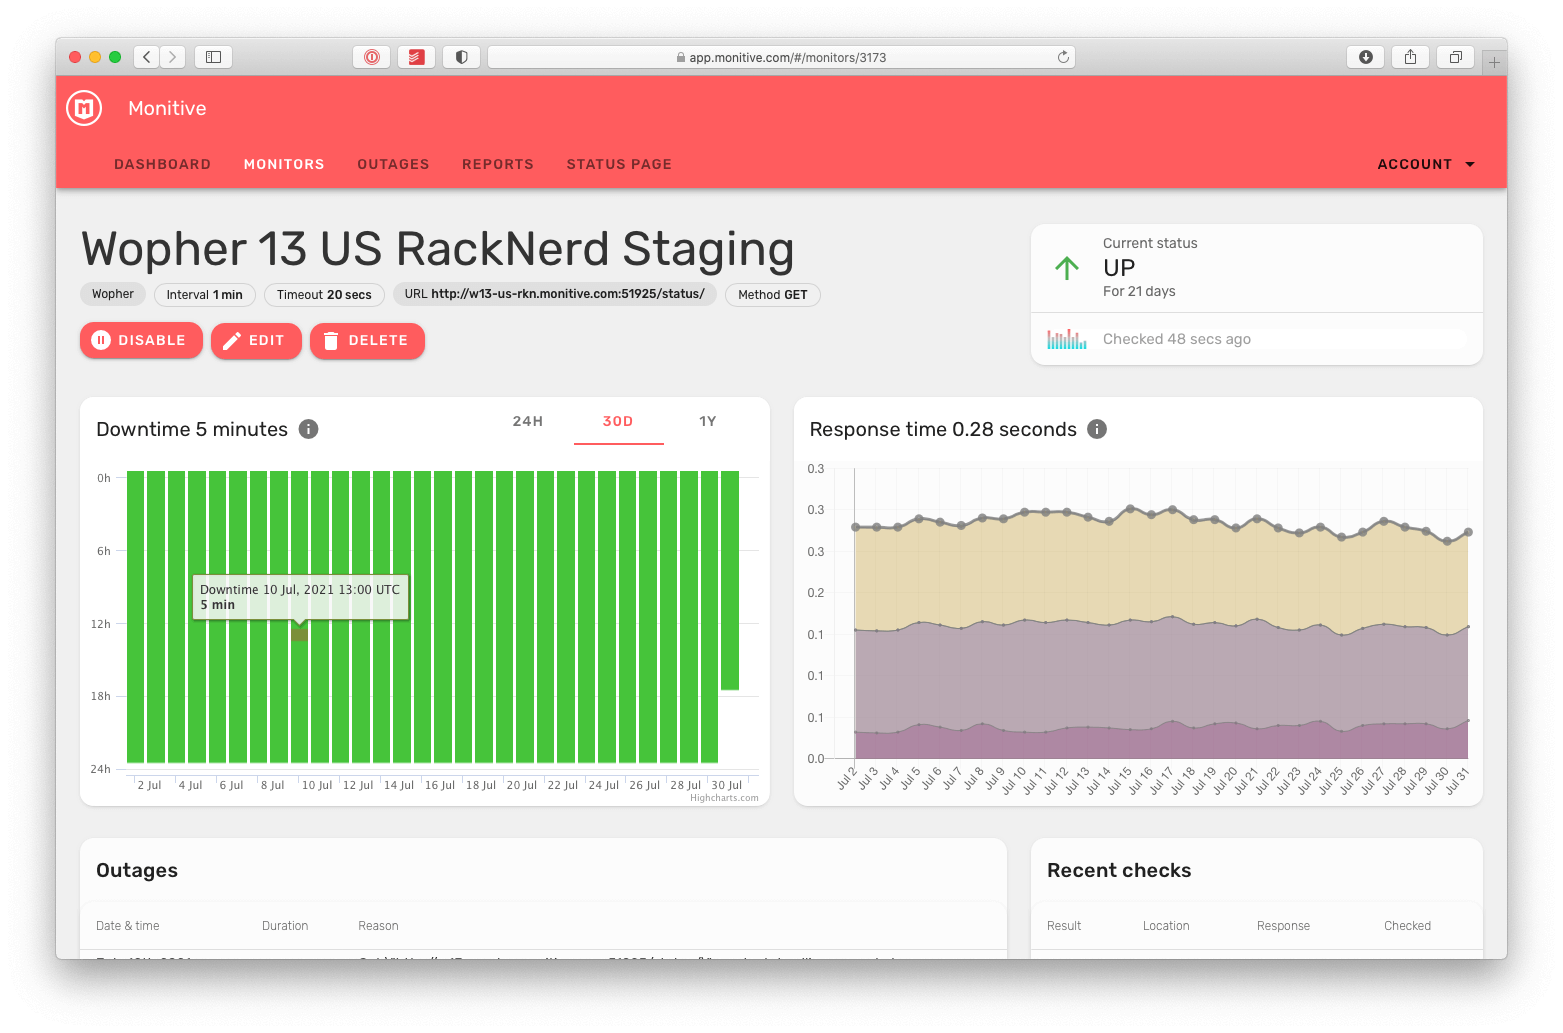
We revamped the availability charts you're seeing for each monitor. You can now spot patterns when you're looking at a monitor's availability.
The chart card has 3 views, one for the last 30 days, one for the last 24 hours and one for the last year.
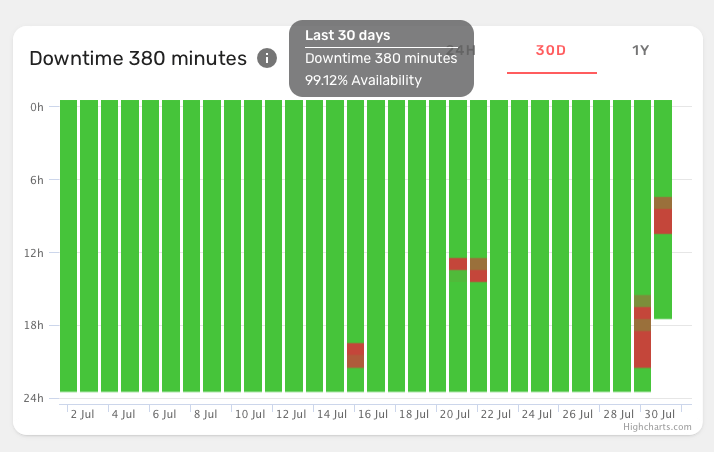
It's much more easier to see how your monitor behaved in the past day, month or year now. Also, for the 30 days view, each column is split in 24 hours so if your website tends to go out at night, you'll see it on the chart.
The availability percentage is now displayed on hover over the (i) next to the downtime in minutes:

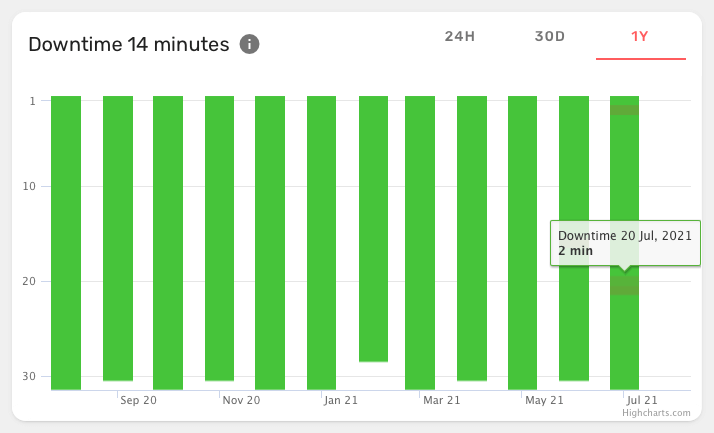
The yearly view helps see the long-term availability of a certain monitor, very useful especially to compare or just find out how much downtime did it have in the past year:

Each bar is a month, and for each month you have the daily breakdown, basically you easily get availability information for all the 365 days in the past year.
Admin Updates
- Added heat-map availability charts for monitor, with 24-hours, 30 days and 1 year views (#215)
- Fixed edit monitor loading error on unknown team channel, mainly useful for migrating to the new alerting channels (#217)
API Updates
- Added request to retrieve monitor's chart-friendly availability data (#565)
- Added support for Email outage/recovery alerts via Notifications (#593)
- Added test SMS credits + Tax Rates product creation to Stripe test-data setup command, useful for Continuous Deployment and testing (#610)
- Fixed raw availability request can't handle ISO date strings (#603)
- Fixed use state attribute for hires data (#601)
- Fixed handle subscription() not found case, when we cannot find the corresponding Stripe subscription (#621)
- Fixed end of hour selection for hi-res precision in the availability charts (#614)
- Fixed test error "partial write: points beyond retention policy dropped=1" (#607)
- Fixed call to tax rates creation method (#612)
- Security update of dependencies (#599)
